
Power BI: the latest updates that drive data analysis

Power BI is a powerful Microsoft tool for data visualisation and business analysis. It enables companies to transform data into interactive reports and customised dashboards, facilitating decision-making based on clear, visual information.
As it continues to grow, Power BI continues to evolve to meet user demands. In September 2024, significant updates were released that enhance both the user experience and the platform’s capabilities. Below, we explore some of the most notable features:
1. Key improvements to the reporting section
One of the cornerstones of Power BI is the ease with which users can design stunning visualisations and structure dynamic reports. The September 2024 update brings significant enhancements to reporting functionality, aimed at optimising the user experience and making it easier to create more dynamic and customised reports. Below, we explore some of the highlights of this update.
Updated menu bar
With the recent update, the menu bar in Power BI has been restructured to offer clearer and more efficient navigation in view mode. This change aims to minimise clutter by grouping similar functions together and optimising button text to improve readability. This makes it easier to access the most frequently used tools, allowing users to focus on data analysis without distraction.

Visual calculations (preview)
Visual calculations are now enabled by default, allowing users to start using them immediately. This feature greatly enhances the interactivity of visualisations, facilitating dynamic data analysis. They allow users to perform operations directly on the visualisations, optimising the workflow and user experience. In addition, this functionality is designed to make the integration of calculations more intuitive and accessible.

Formatting strings at visual level (preview)
This new feature allows customising the formatting of fields and measures directly within visualisations, increasing flexibility in data presentation. Users can now apply specific formatting, such as text or currency, to individual elements in their charts. In this way, they are not solely dependent on the global settings of the model.

This simplifies the formatting process and allows each visualisation to better reflect the information you want to convey.
Teams integration
The update includes support for multi-factor authentication (MFA), which significantly improves collaboration security within Microsoft Teams. This feature allows users to work more securely by requiring multiple forms of verification before accessing reports and sensitive data.

The integration between Power BI and Teams becomes more robust, facilitating effective and secure collaboration in work environments that rely on shared data analytics.
Multiple apps per organisation
With the latest update, it is now possible to manage multiple applications within a single workspace, making it easier to organise and access different resources. This functionality also allows administrators to customise the colours of each application. This provides better visual differentiation and a more cohesive user experience.

This enhancement is especially useful for large organisations that handle multiple projects and wish to maintain an orderly and easily accessible structure.
Report subscriptions
Finally, the possibility to subscribe to specific reports is introduced, allowing users to receive automatic updates on the last day of the month. This feature makes it easier for teams to stay on top of the latest data and ensures that everyone is informed about important changes in reports.
The subscription personalises the user experience, allowing them to receive relevant information without the need to manually access the platform.
2. Dark mode in Power BI Desktop
One of the most anticipated features for Power BI users is the inclusion of dark mode in Power BI Desktop. It not only improves the visual experience for those who work long hours with the platform. It is also beneficial for eye care, reducing eye fatigue, especially in low-light environments.

The dark mode interface allows for a more comfortable and less intrusive approach to data visualisation, making the platform more user-friendly for those who prefer to work in visually softer environments. In addition, dark mode can help highlight colours and visualisations, making data easier to analyse and understand.
If you want to activate dark mode, just follow these simple steps:
- Go to ‘File’ and click on the ‘Options and settings’ section.
- Under ‘Options’, look for the ‘General’ section.
- Then select ‘Report settings’. Here you will find different customisation options.
- You can choose between default mode, dark mode, light mode, or user system mode, which adapts to your operating system configuration.
- Once you have made your selection, simply click OK to save your changes. This flexibility allows you to customise your work environment to suit your preferences.
3. Improved data and model structuring in Power BI
Power BI has introduced several new features to its data modelling approach, allowing users to manage and structure information more effectively.
Introduction to Fabric Metrics Layer
One of the key innovations in Power BI is the Fabric Metrics Layer, which allows users to define and manage metrics centrally. This functionality makes it easier to create and track key performance indicators (KPIs), helping organizations evaluate their performance against established strategic objectives.
Fabric Metrics Layer not only centralizes metrics management, but also improves collaboration across teams. Users can share metrics more effectively, ensuring that everyone in the organization has access to consistent and up-to-date information. This results in more informed and aligned decisions, as each area of the organization can rely on common data to assess their progress and make adjustments as needed.
With this tool, Power BI strengthens its ability to serve as a comprehensive data analytics platform. Therefore, you can focus on the clarity and accessibility of the critical metrics that drive business success.
Live editing of semantic models in Direct Lake Mode
The new Live Editing of Semantic Models in Direct Lake Mode allows analysts to make changes to their data models in real-time. This represents a significant advance in the agility and efficiency of data analysis.
This live editing capability eliminates the need for interruptions, allowing users to dynamically adjust and optimize their models according to the needs of the moment.

Thanks to this feature, teams can respond more quickly to emerging questions and requirements, improving decision-making based on up-to-date data. In addition, this flexibility encourages collaboration between analysts and other stakeholders, as everyone can see and understand changes in real time, which empowers a more agile and information-centric work culture.
To explore more about how to get the most out of this functionality in Power BI, you can check out the full article here.
Q&A support for semantic models with OLS
The addition of Q&A support for semantic models with OLS (Object-Level Security) is a significant advancement in user interaction with data. This functionality allows users to ask questions in natural language, making it easier to query and analyze relevant information. With this enhancement, users can access valuable insights quickly and efficiently, without the need for in-depth technical knowledge.
Likewise, the use of OLS ensures that data is securely accessible, allowing each user to see only the information to which they are entitled. Not only does this make it easier to make informed decisions, but it also promotes a more collaborative and transparent work environment. The combination of these capabilities transforms the way teams interact with data, driving an evidence-based culture.
4. Power BI mobile experience enhancements
The Power BI update has introduced significant improvements to the mobile experience, highlighting the support for NFC (Near Field Communication). This functionality allows users to share and view reports with a simple touch, eliminating the need for complicated connections. In corporate environments, such as meetings and conferences, this feature streamlines collaborative analysis, facilitating the instant transfer of information between devices.
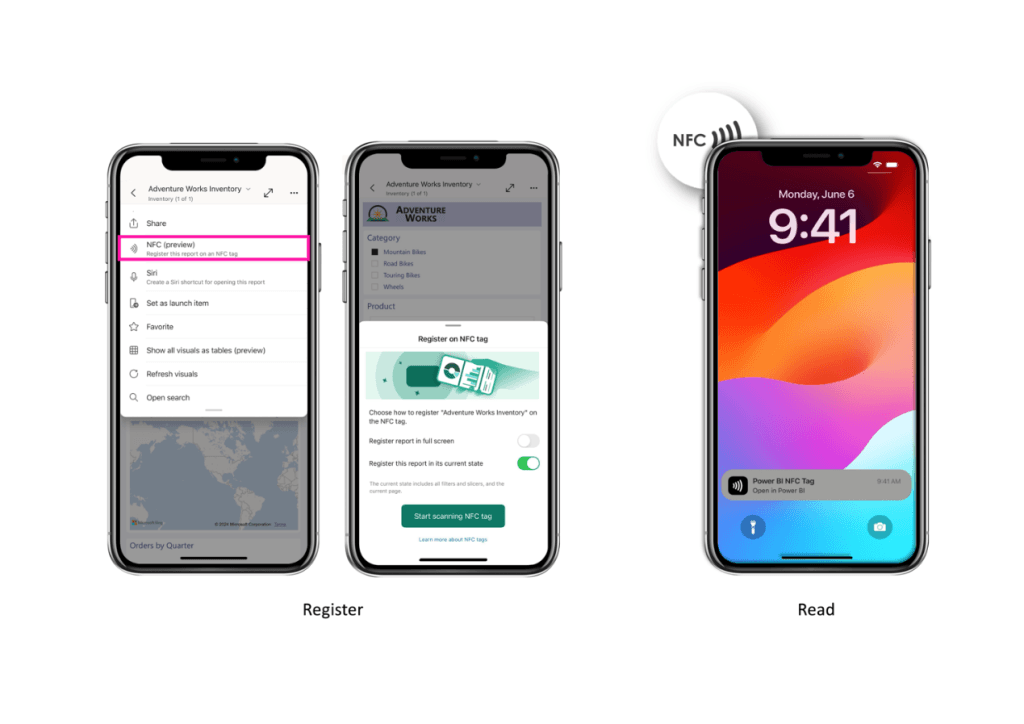
In addition, the user interfaces have been optimized to ensure more intuitive navigation and quick access to essential reports, making decision-making smoother and more effective.
For more information on this functionality, you can visit the full article here.
5. Other Improvements
The September 2024 update not only brings new features, but also includes important optimizations to the overall performance of the platform. Bug fixes have been implemented and artificial intelligence capabilities have been improved. These enhancements make it easier to integrate machine learning and automation, allowing users to perform predictive analytics more easily and make more informed, data-driven decisions. Power BI continues to evolve to meet the analytics needs of modern users.
Conclusion
Recent updates to Power BI reinforce its position as an essential tool for data analysis. These enhancements are designed to make daily work easier, promote more effective collaboration, and ensure that business decisions are based on accurate and up-to-date data.
To take full advantage of these new features and take your data analysis to the next level, we invite you to contact us. Our team of experts is ready to help you implement and optimize Power BI in your organization, ensuring you get the most value from your data. Don’t wait any longer and transform the way you work with data today!